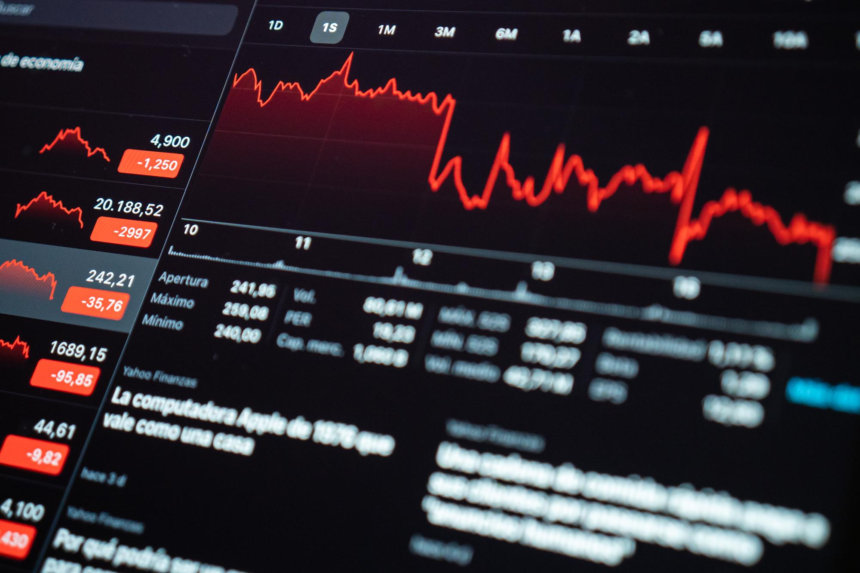
Are you a beginner in trading stocks? Before you begin investing real capital, it is important to learn how to read the charts to understand the trends, mark levels, confirm volume, and choose the right timeframe. This blog explains these basics for all Indian stock traders exploring the NSE/BSE market for the first time.
Key Takeaways
- Selecting the Chart: Master reading the market sentiment through candlestick, bar, and line charts. Candlesticks may offer the most detailed price action insights.
- Market Structure:Identify overall up, down, or sideways market trends. Also, identify key support and resistance zones where buying or selling pressure can peak.
- A 5-Step Execution Plan: Build a disciplined trading strategy. To do so, you need to make sure to analyze daily charts, map key levels, and validate the volume. Finally, you need to wait for confirmation before placing your trade.
A stock chart graphs your share’s price over time, so you (as a buyer or seller) can see where you have acted before. When you read them, you can spot the trend, key price levels, the candles, and volume at those levels.
In FY26, SEBI reported that the number of loss-making individuals in equity trading came to 87.7%. A 3.2 percentage point drop from 90.9% in FY25. This can be attributed to trading complex derivatives without basic chart-reading skills. Thus, it is safer to begin with cash-segment stock trading on a daily chart.
This blog will explain the fundamentals. As learning to read charts carefully can be the way forward.
What You Will See on a Stock Chart
There are candle charts, where each candle summarizes four prices for a period, which include open, high, low, and close. A bar chart also shows the same things, except with vertical lines. On the contrary, a line chart only shows closes.
The usual color convention (candle charts) is green. This means that the closing price is higher than the opening price. However, most platforms let you customize colors. So, read the open versus close terms. Do not just rely on the color.
Furthermore, charts on Indian platforms adjust for splits and bonuses. So, old prices may differ from what you remember. Here is the anatomy of a candlestick:
Body: Records the open-to-close gap. If it is long, it means decisive, and if it is short, it means hesitant.
Upper Wick: Records the session high. And a long wick means sellers have rejected higher prices.
Lower Wick: Records the session low. And a long wick suggests that buyers defended lower prices.
Color: Records the close versus open. Usually, green/white means close above open and red/black means below.
Close Position: Records the close within range. Here, near high means strength and near low means weakness.
Find the Trend, Support & Resistance
Trend is the direction towards which prices move. An uptrend includes ascending peaks and troughs (higher highs and higher lows). A downtrend has descending peaks and troughs (lower highs and lower lows). Moreover, a sideways trend (price oscillates between floor and ceiling) is when prices move horizontally.
Here, support is a level where buying repeatedly emerges, and resistance is a level where selling repeatedly caps price. In these zones, buying or selling pressure can be strong enough to stop or reverse any price trend. Trend and levels form the backbone of any beginner trading guide. This is because every pattern is judged against them.
Confirm with Volume and the Right Timeframe
A move through a level on any above-average volume is more credible than a move on thin volume. The best practice would be to read weekly/daily charts for trend, then lower your timeframes for timing.
Keep in mind that the NSE/BSE cash session runs from 9:15 to 15:30 IST (continuous session) and the opening minutes are often volatile. You should know when to begin. Furthermore, share trading for beginners works best top-down. Starting with the daily chart and zooming in might be the best option here.
Read the Candle Signals at Key Levels
A candle can be very important. This is usually when it forms at support or resistance, and the volume agrees. Plus, patterns are conditions to confirm your actions, not predictions. Here’s what you should know:
Hammer: A small body with a longer wick after a fall suggests buyers are rejecting lower prices. Confirm with the next close higher and near support.
Shooting Star: A small body with a long upper wick after a rise means sellers are rejecting higher prices. Confirm with the next close lower and near resistance.
Engulfing: Body fully covers the prior opposite candle, suggesting a momentum shift to that side, which can be confirmed by above-average volume.
Doji: Open and close nearly equal, suggesting indecision, and the next candle’s direction confirms it.
Five-Step Routine to Follow for Any NSE Stock
Use this repeatable five-step method as a beginner trading guide that you can implement on any NSE stock.
- Open a daily chart
- Label the trend
- Mark support and resistance
- Check volume at those levels
- Wait for a candle close and fix your exit
Case Example
Priya is a first-time investor who opened an NSE large-cap stock’s daily chart. The price already bounced off ₹1500 support three times. And the latest green candle showed a long lower wick on rising volume. She had to wait for the next daily close to confirm.
Mistakes to Avoid as a Beginner
The most common error in share trading for beginners is to act on a single candle. Also, avoid ignoring the exit level, using very short timeframes at the beginning, and stacking indicators.
Caution!
Candlestick patterns are probabilities, not promises. There is a high risk of losing money if you do not implement proper tools and strategies carefully. Practice on paper and keep position sizes small. Another good practice here is to set an exit level. Make sure your broker platform is SEBI-regulated before trading with real capital.
Conclusion
Chart reading is a skill that you can develop through repeated practice, not prediction. Treat every pattern as a probability. Define your exit first and always start small. Charts help you trade with a plan. However, they don’t eliminate risks.
First Time as a Share Trader? You Need Proper Practice!
Look for apps/platforms that allow demo/paper trading for beginner stock traders before you start trading for real to learn how trading works.